Последний отзыв

От книги невозможно оторваться, супер интересная
По всем вопросам обращайтесь на: info@litportal.ru
(©) 2003-2024.
✖


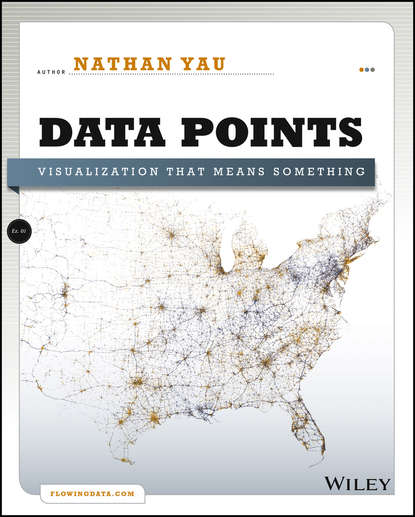
Data Points. Visualization That Means Something
Автор
Год написания книги
2018
A fresh look at visualization from the author of Visualize This Whether it's statistical charts, geographic maps, or the snappy graphical statistics you see on your favorite news sites, the art of data graphics or visualization is fast becoming a movement of its own. In Data Points: Visualization That Means Something, author Nathan Yau presents an intriguing complement to his bestseller Visualize This, this time focusing on the graphics side of data analysis. Using examples from art, design, business, statistics, cartography, and online media, he explores both standard-and not so standard-concepts and ideas about illustrating data. Shares intriguing ideas from Nathan Yau, author of Visualize This and creator of flowingdata.com, with over 66,000 subscribers Focuses on visualization, data graphics that help viewers see trends and patterns they might not otherwise see in a table Includes examples from the author's own illustrations, as well as from professionals in statistics, art, design, business, computer science, cartography, and more Examines standard rules across all visualization applications, then explores when and where you can break those rules Create visualizations that register at all levels, with Data Points: Visualization That Means Something.
На сайте электронной библиотеки Litportal вы можете скачать книгу Data Points. Visualization That Means Something в формате fb2, rtf, pdf, txt, epub. У нас можно прочитать отзывы и рецензии о этом произведении.
Помогите, пожалуйста, другим читателям нашего сайта, оставьте отзыв или рецензию о прочитанной книге.
Спасибо! Ваш отзыв был отправлен на модерацию.
Отзывы о книге Data Points. Visualization That Means Something
список сообщений пуст
Другие электронные книги автора Nathan Yau
Последний отзыв
От книги невозможно оторваться, супер интересная